Project Report: Parse Server On-Premise Deployment
Title: On Premise Deployments
Project Description:
The project aims to provide a solution for the On-Premise application deployments to handle the company’s (here Atlan) enterprise clients. The use-case includes managing multi cluster (micro-services) applications in an On-Premise Deployment setup. Further expanding to Cluster (and other included resources) monitoring, health-checks, alerts, managing updates/upgrades and finally Disaster Recovery (basically backup and restore mechanism).
Installation / Usage Instructions:
Before laying down steps/instructions for the installation, I am compiling up the tools/softwares/services that I have used for reaching the solution (no particular order).
- Google Cloud Platform (GCP) for VMs
- Docker
- Kubernetes
- Rancher
- Helm/ Helm Charts
- Google Kubernetes Engine (GKE)
- Prometheus and Grafana
- Weave Cloud
- Velero
Pre-requisites:
-
Four VMs or baremetal machines (whose external IP address should be publicly accessible).
- 1 VM for serving as an On-Prem multi-cluster Orchestration platform.
- Rest 3 VMs for deploying the actual application (Parse Server) and other required tools.
Note: I am using GCP Compute-Engine VM instances for my solution.
Steps:
-
Create the first GCP compute-engine VM instance (in my case, an Ubuntu 18.04 LTS VM, n1-standard-4, 4 vCPUs, 15 GB memory). This article here will cover the steps to create and connect to Google Cloud VMs via SSH.
-
Once you SSH into the VM, the next step is to setup Rancher (which is an open-source on-premise multi-cluster orchestration platform). Rancher requires a Kubernetes environment and a Docker setup for it’s installation.
-
Kubernetes setup: We basically require two thing to be configured here.
- An installed kubectl command-line tool (official documentation for installation).
- And a kubeconfig file (default location is ~/.kube/config) (Check this link for reference).
-
Docker setup:
-
This article will cover the steps to install and start using Docker on a Linux machine.
-
Make sure to add the current username to the docker group to avoid typing sudo while executing docker commands. (Command:
sudo usermod -aG docker ${USER})
-
-
After setting up above tools, now it’s time to setup Rancher UI (I will be running Rancher as a docker container on port 80).
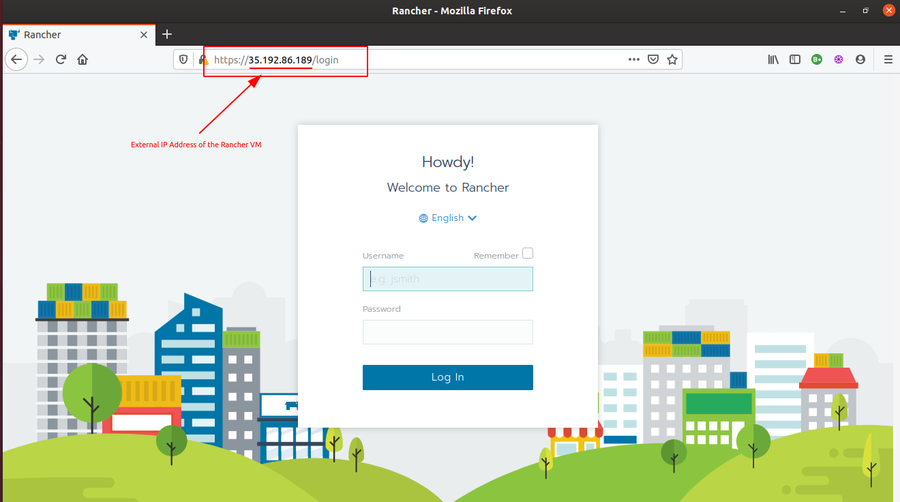
docker run -dti --restart unless-stopped -p 80:80 -p 443:443 rancher/rancher- Once the above docker container is up and running, you can login to Rancher UI by accessing the URL,
http://<ipaddress>, whereis the external IP address of your VM. Then set up a password for the *admin* user to use it further.
-
-
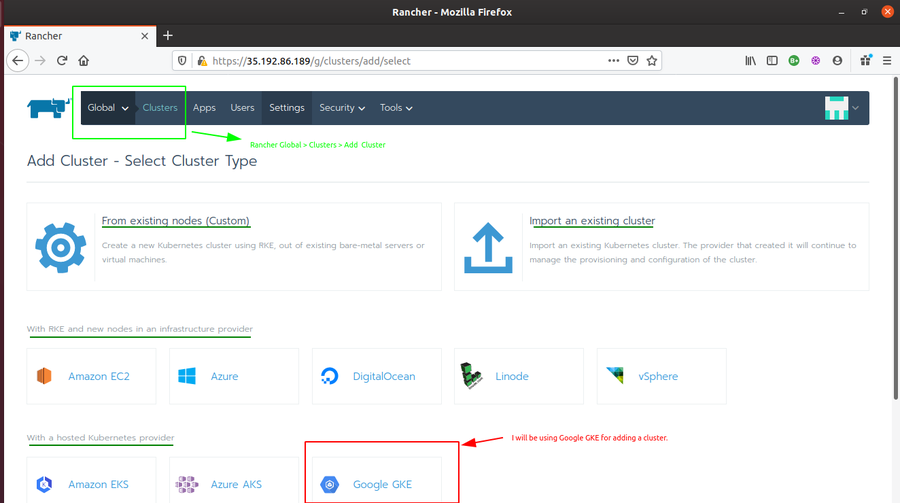
Next step is to create a Kubernetes cluster for deploying our application. I am using GKE (Google Kubernetes Engine) for creating a cluster with 3 nodes. These 3 nodes will be utilized for deploying the application.
-
After you are logged in inside the Rancher UI, Do the following.
-
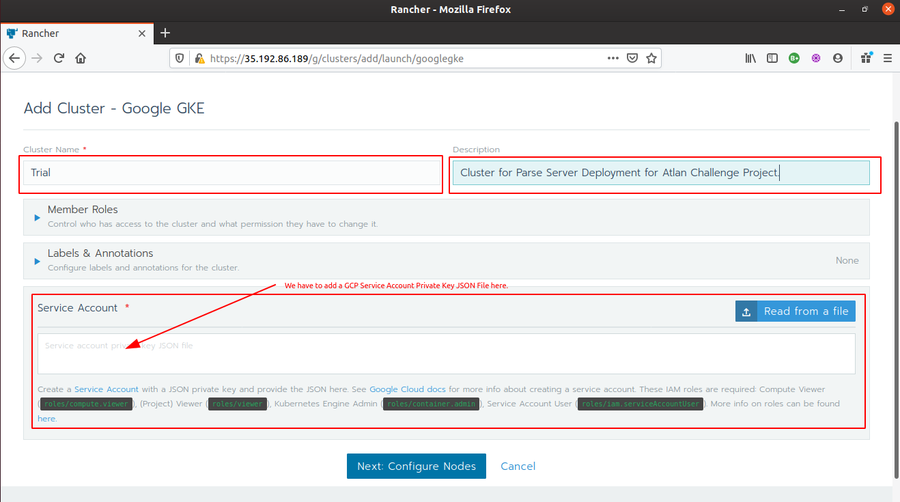
click on Rancher Global > Clusters > Add Cluster > Google GKEand fill up the required fields.
-
For service account, you have to add a GCP service account JSON key (check here for how to create a service account key).
-
Once you are done adding the private key JSON File, click on Next:Configure Nodes, configure the settings for the 3 nodes and Click Create. It will take a few minutes to create the cluster.
-
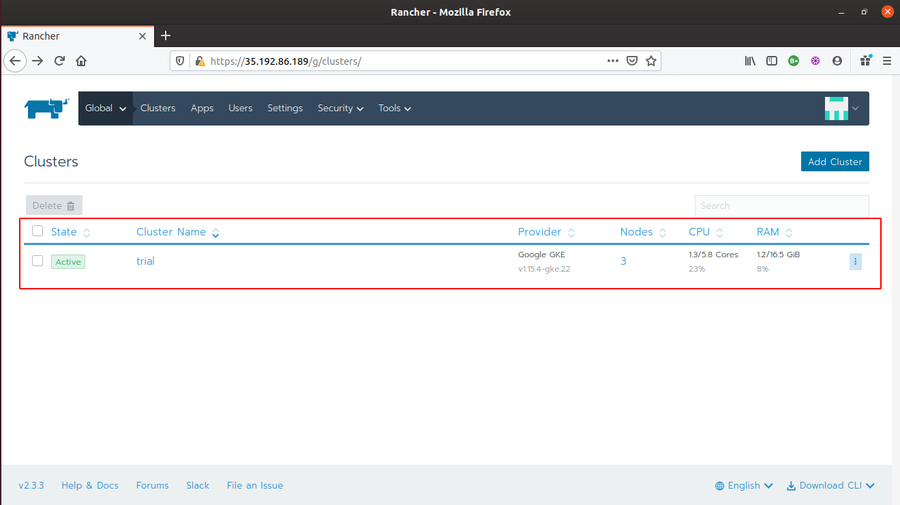
As the cluster turns into
Activestate, the 3 nodes are created and the cluster is ready for further steps.
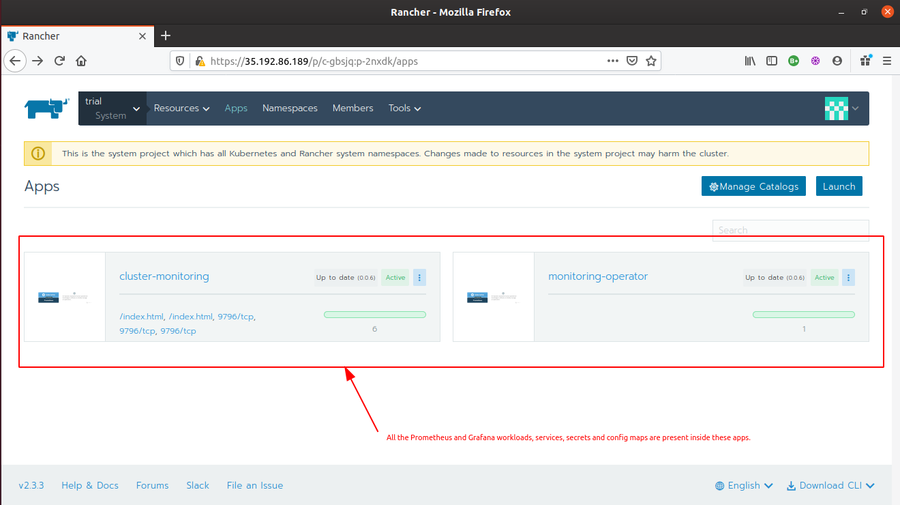
- We are not required to setup Prometheus/Grafana from scratch here. Rancher provides inbuilt monitoring features which uses Prometheus and Grafana for creating Metrics Graphs.
-
-
The next step is to set up Prometheus Monitoring and enable Grafana Dashboard for live metrics monitoring.
-
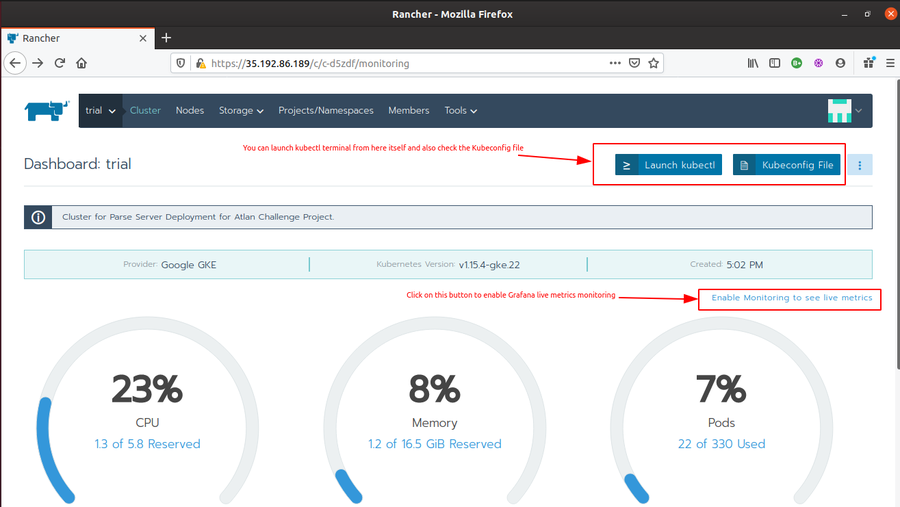
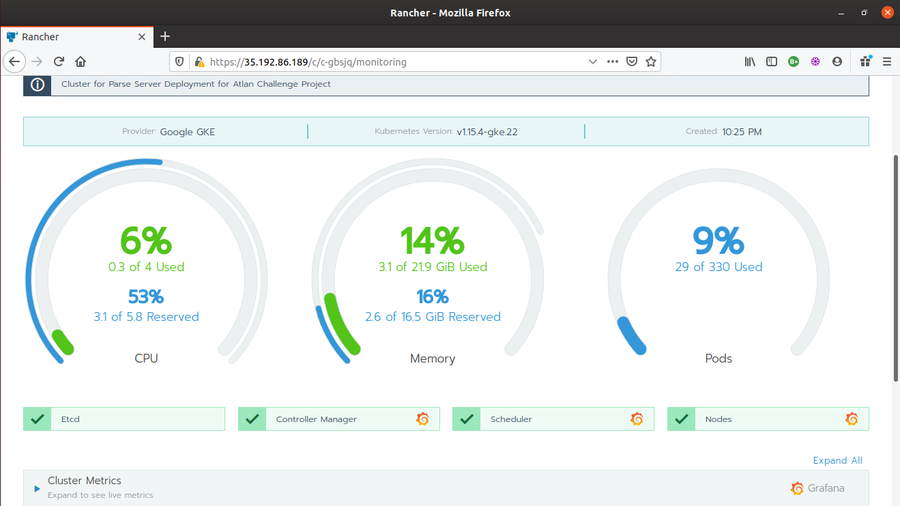
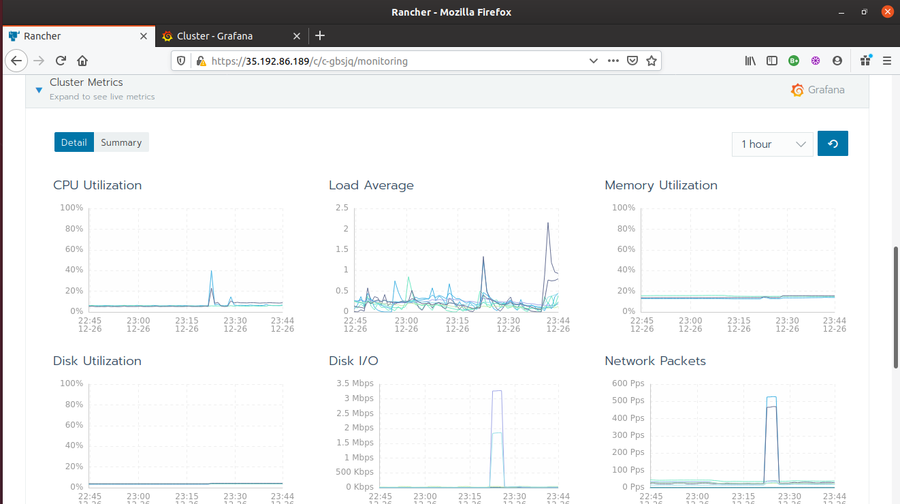
Go to Rancher Global > Clusters > {Trial} > Dashboard. The Dashboard will show Prometheus data for CPU utilization, Memory Utilization, number/percentage of Pods in use, and other cluster events.
-
Click on Enable Monitoring to see live metrics button to enable Grafana Dashboard, and thus, Grafana live metrics monitoring. Fill the required fields and click enable. It will show
Monitoring API is not readyfor few minutes. Once you see Grafana Icons at various places in the Cluster Monitoring Dashboard, the Grafana Dashboard is ready.
- Click on any of the Grafana icons/logos. It will launch Grafana Dashboard.
-
-
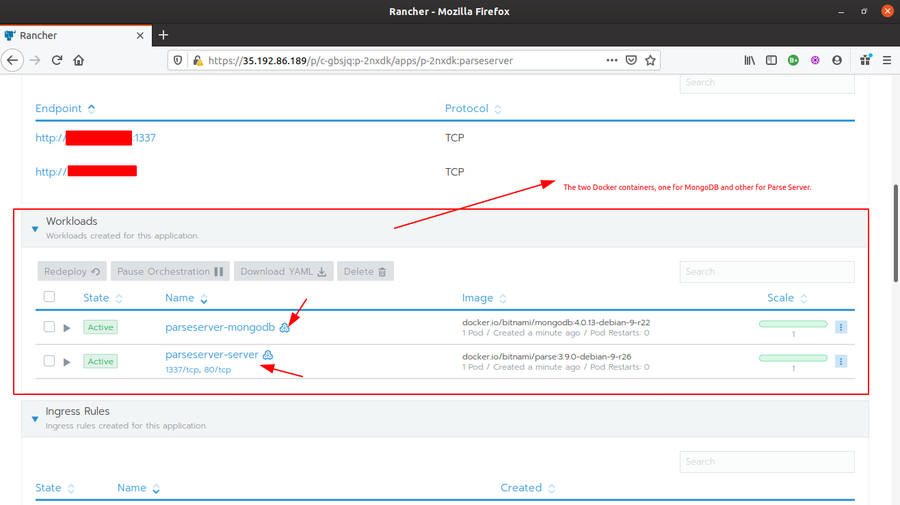
Now is the time for deploying the Parse Server application in the Trial cluster. There are several ways to deploy application in a cluster from Rancher UI. The most common being deploy using Docker images (check this article for the same). But our application (Parse Server) is a multi-image application. In normal case, it first requires setting up pods for MongoDB server (so, a mongo:latest docker image) and then the actual Parse Server application in other pods (using custom image using Dockerfile). And, finally linking them together in order to establish communication. For a large scale deployment, this is definitely not a good approach. Therefore, the best solution here is to deploy the application using Helm Charts. Fortunately, we have a Helm Chart already available for the Parse Server application. Below are the steps to deploy the application using the available Helm Chart.
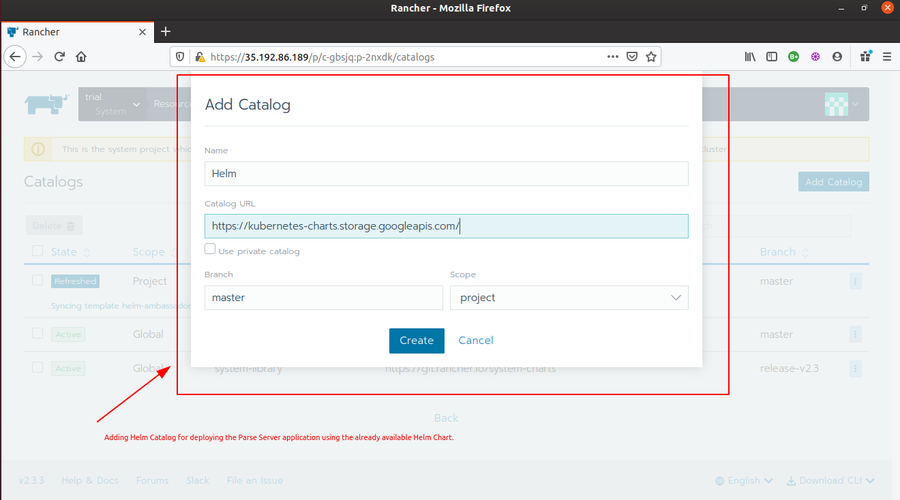
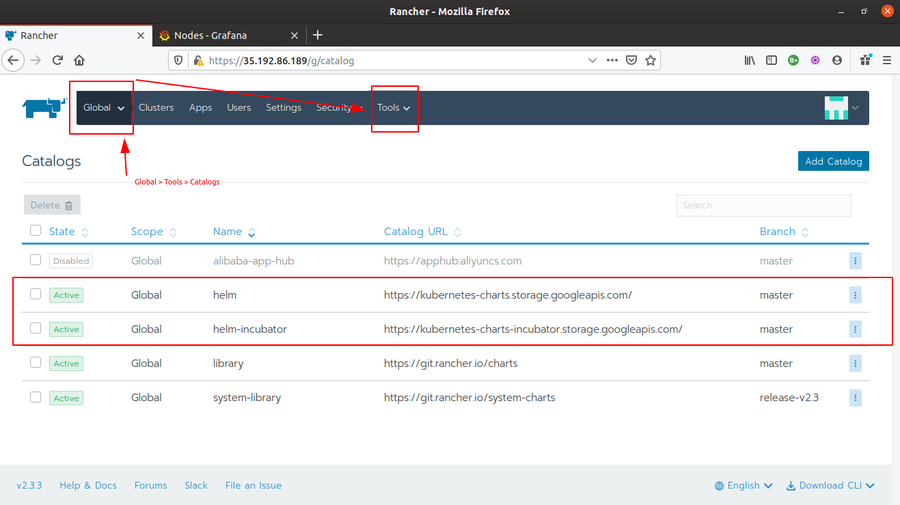
- Go to Rancher Global > Tools > Catalogs and add a
Helmcatalog by passinghttps://kubernetes-charts.storage.googleapis.com/as Catalog URL. And then wait for it to turn into an active state.
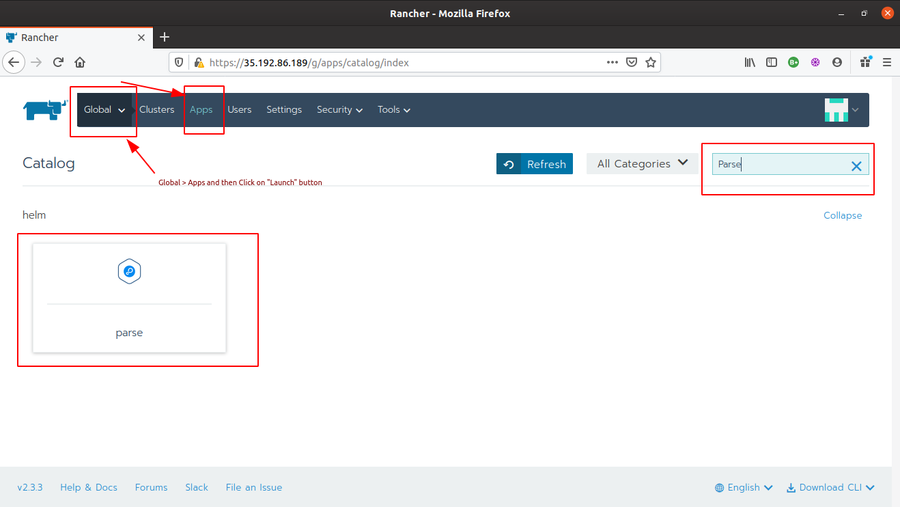
- Then Go to Rancher Global > Apps and click Launch button. In the search bar, type “Parse” and you will see a Parse Helm Chart available there.
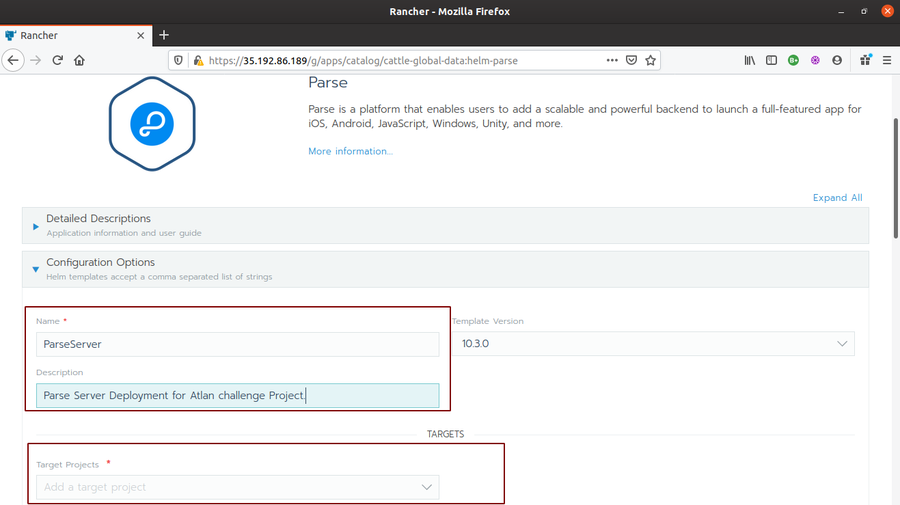
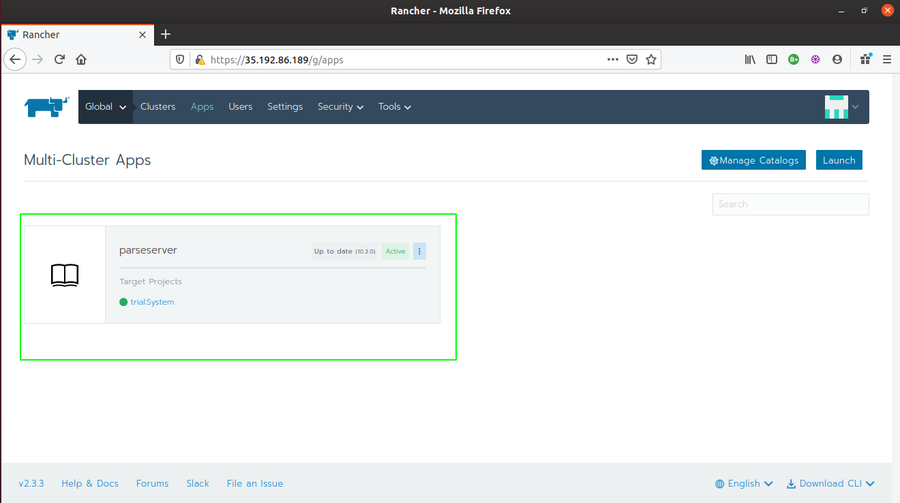
- Click on the Parse Helm Chart. Write a name for it (I chose parseserver) and Target Project (in my case, Trial>System). You can set your custom configurations as well if required. I left it as default. Finally, click on Launch. And wait for the application status to turn
Active.
- Go to Rancher Global > Tools > Catalogs and add a
-
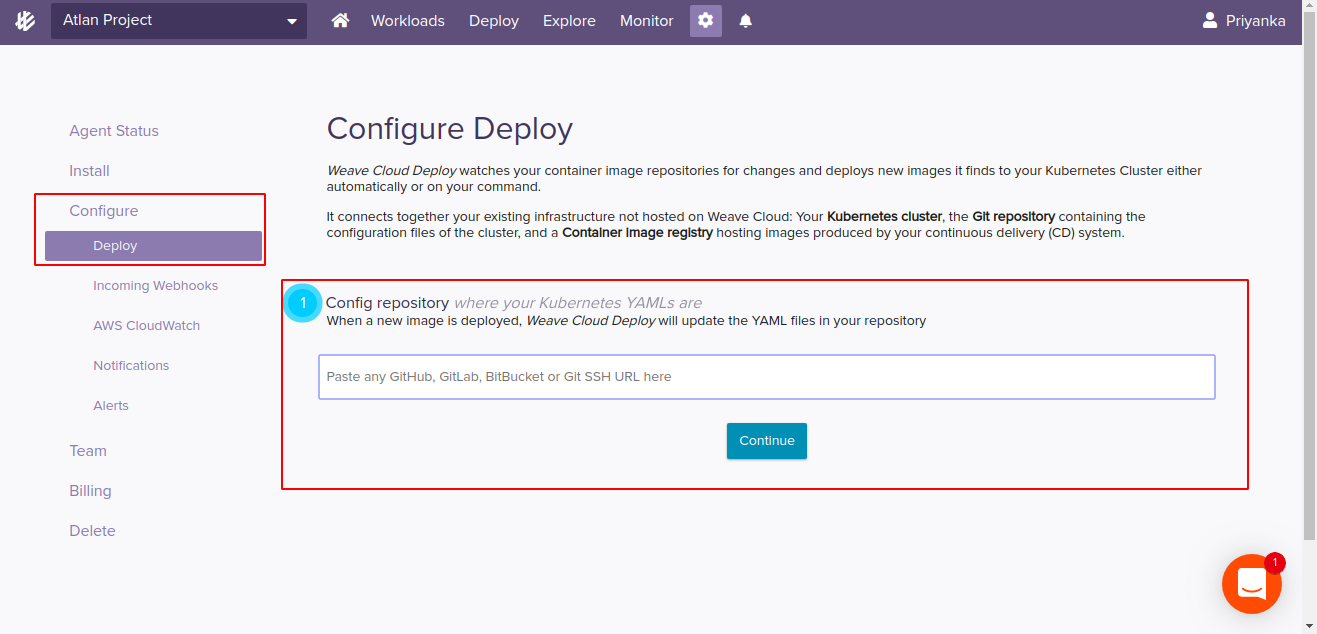
Although Rancher provides internal options to easily rollout/rollback updates/upgrades in the deployed application. But another good solution for rolling out changes directly from the Source Repository is via creating a CI/CD pipleline. I will be using Weave Cloud for setting up a pipeline for this project.
-
Head on to https://cloud.weave.works/ and login.
-
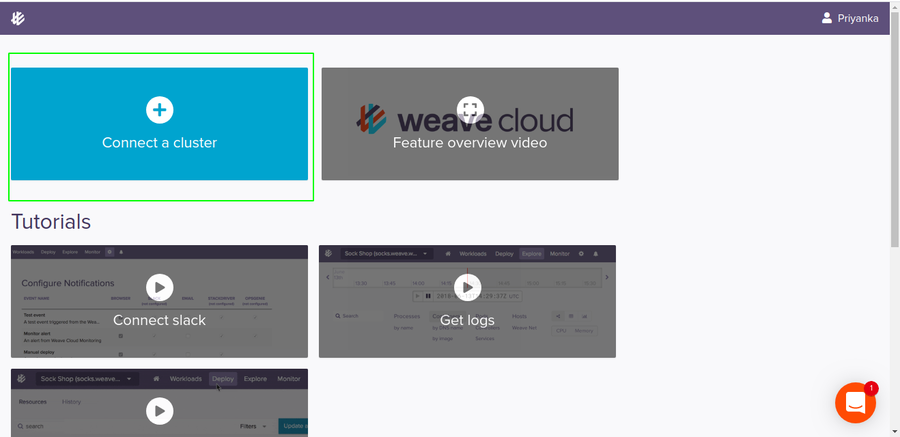
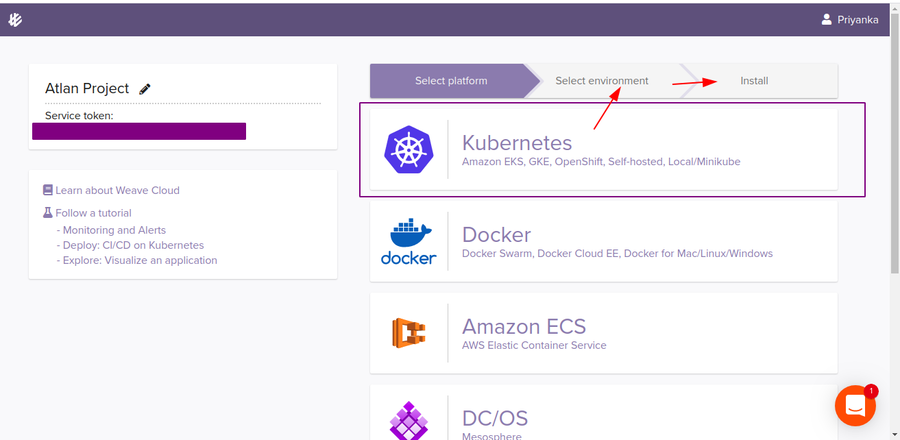
Click on Connect to Cluster and create an instance by passing an instance name (I named it Atlan Project) and creating a team.
- Once the instance is created, you will be redirected to project instance Dashboard. From there, Choose Kubernetes as Platform > Generic Kubernetes as Environment. You will then see some terminal commands to install Weave Cloud agents on the cluster.
-
Copy the standard command and go back to Rancher Global > Cluster. Select Trial cluster and click on launch kubectl from the cluster Dashboard. Once the terminal is open, run the copied standard command there.
-
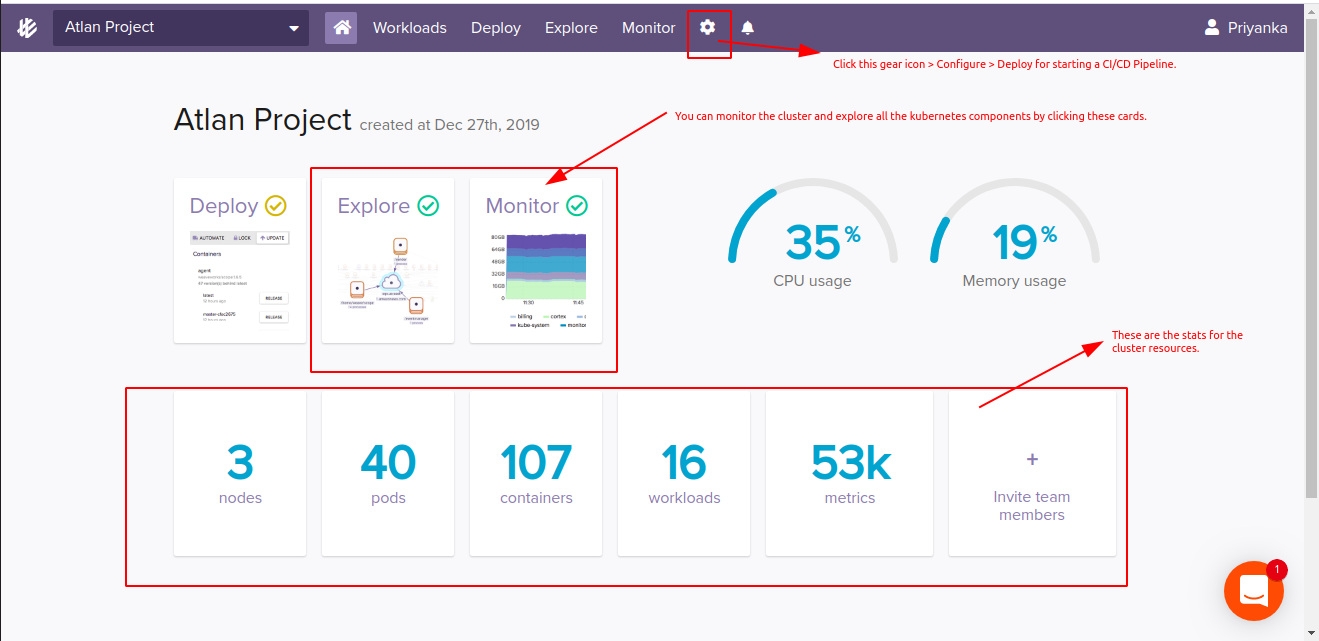
After all the agents are successfully created in the cluster, Weave Cloud will ultimately trace it and notify you for the cluster connection. You will then be able to see all the live metrics, resources and graphs from Weave Cloud as well.
- Now for the CI/CD part, click on the settings/gear icon and then configure. Pass the Git source repository (where all the helm charts, Dockerfile and other kubenetes manifests are present. Here I have created a fork of the upstream project and passing that). Make sure you have write access to the repository. Once you confirm the write access, It will add auth keys to your git repo platform (GitHub in my case). And then, again run the shown commands in your kubectl terminal. That’s all for setting up CI/CD Pipeline for the project.
-
-
Finally, we are left with setting up our Disaster Management setup. I will be using Velero for the same. Velero has 2 major components i.e. velero-cli — a command-line client that runs locally, and velero deployment — a server that runs on your cluster.
- Open the cluster kubectl terminal from Rancher Global > Cluster > Launch kubectl and pull down the Heptio Velero GitHub repo there.
$ git clone https://github.com/heptio/velero- Apply some basic prerequisites (e.g. CustomResourceDefinitions, namespaces, and RBAC).
kubectl apply -f velero/examples/common/00-prereqs.yaml- Apply a local storage service (e.g. Minio)
kubectl apply -f velero/examples/minio/- Check to see if Velero deployment have been successfully created.
kubectl get deployments -l component=velero --namespace=velero- Now, download and install the Velero client.
  curl -LO https://github.com/heptio/velero/releases/download/v0.11.0/velero-v0.11.0-linux-amd64.tar.gz

  tar -C /usr/local/bin -xzvf velero-v0.11.0-linux-amd64.tar.gz
That’s all for the installation and environment setup.
Use Cases, Edge Conditions and Assumptions
-
It is assumed that we have enough volumes and disk space available for performing updates/upgrades, scaling environment etc.
-
It is assumed that the application development follows a strictly GitOps approach for CI/CD.
-
The next assumption here is that every commit coming from the remote git source repo is already code analysed. Thus, there is no Code Analysis performed before deployment to the cluster (due to GitOps approach).
-
In case of Disaster Recovery, It is assumed that no disaster will happen to the cluster as whole (only internal disasters are assumed). So, the resource backups for created inside the Cluster’s local space only. (Where in the opposite case, One should ideally have a backup of the whole cluster setup in an external cloud storage. That is possible but I am not going to that part due to lack of cloud storage resources for now.)
Workflow
The whole workflow is basically created around the major points/sectors that were mentioned in the assignment problem document. So, it mainly focus on providing a solution for each one of the point mentioned below.
Ease of clustered enterprise level deployments
After doing a good research on what exactly an On-Premise setup is, and what are the tools available in the market for the same. I finally came across this post from Kubedex which provided a very detailed comparision among various Kubernetes On-Prem solutions available. The recommended tool was Rancher, so, I decided to go with it. Rancher runs inside a Docker container and hosts a User Interface for fulfilling all the On-Prem cluster orchestriation requirements.
-
Being considerate about the ease part of the clustered enterprise level deployments, Rancher serves it to the best. There are multiple ways to create Kubernetes cluster in Rancher. You can even import your existing clusters. Out of the 2 most common ways, one is via creating clusters with RKE and then new nodes in an infrastructure provider like Linode, Amazon EC2 etc and other (which I am currently using) is creating cluster with a hosted Kubernetes provider.
-
Rancher basically provides solution for almost all the below mentioned points via just a single User interface.
Incremental remotely triggered application updates
For remotely triggered incremental updates, this solution provides 2 workflows.
-
The Weave Cloud CI/CD Pipeline which enables triggering updates/upgrades and other changes (by altering the Kubernetes manifests in the source Helm Charts) remotely from the Git Source repositories itself. The Weave Cloud follows a GitOps approach, so any new PR/commits pushed to the application’s git source repository will trigger a build, and then a new Docker image/Helm Chart will be created and deployed to the application’s Kubernetes cluster.
-
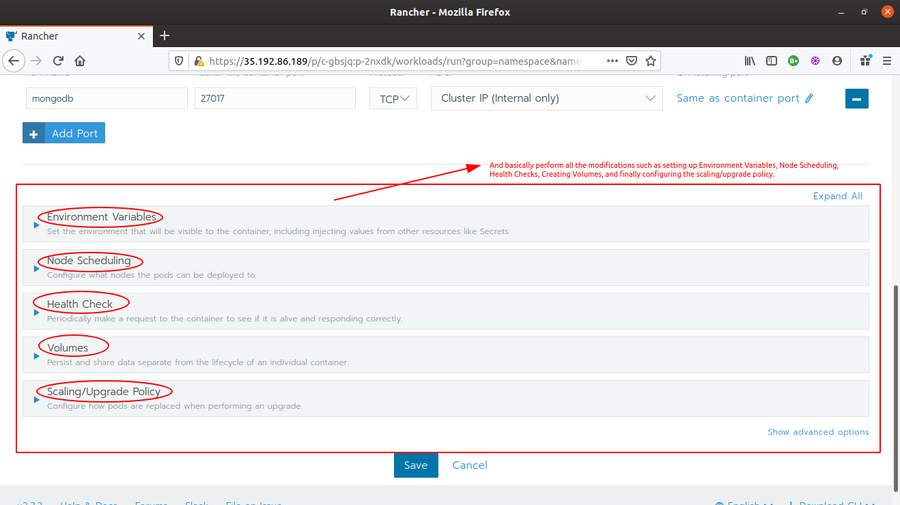
The second is Rancher UI itself, which provides inbuilt features for all the facilities such as rolling out and rolling back updates, node scheduling, scaling the nodes and podes horizontally, creating persistent and external disk volumes, upgrading the cluster as whole, and almost every other thing. One (the user which has admin access) can see and edit YAML files for all the Kubernetes components, and even the KubeConfig files, from the UI itself.
So, in both the cases there is not a single requirement for the system administrators to go locally for pushing updates/upgrades.
Health Alerts and Monitoring
As we discussed during the installation part only, that we are not required to install any monitoring tool by ourselves. The Rancher provides us with two of the most popular monitoring tools i.e. Prometheus and Grafana in it’s UI itself. Both these tools runs as services inside 2 monitoring Apps i.e monitoring-operater and cluster-monitoring deployed inside the cluster.
-
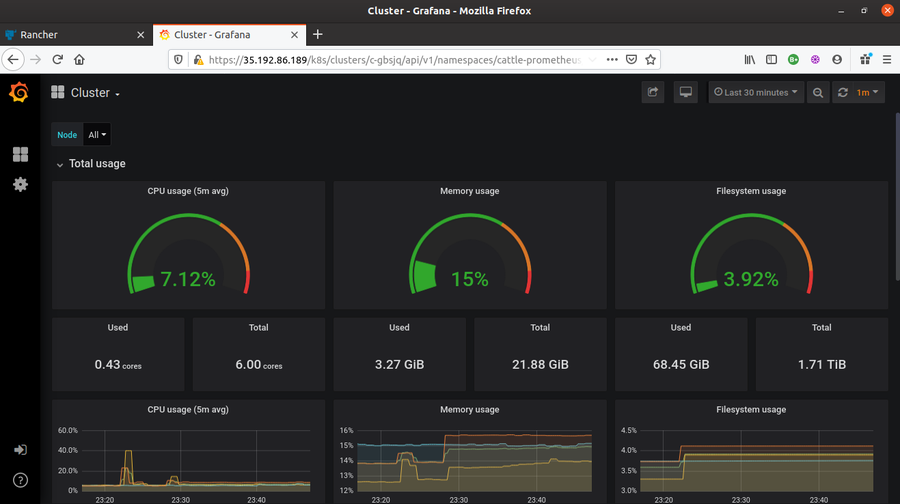
Prometheus provides metrics like CPU utilization, number/percentage of pods in use, Memory Utilization and other cluster events. While Grafana provides live metrics monitoring for clusters and collect a varied range of metrices (like Cluster Metrics, Kubernetes components metrices and Rancher logging metrices).
-
Grafana also provides a separate dashboard where the metrics are more detailed and human readable. Grafana creates metrics graphs which can be utilized for a better cluster health analysis and debugging in case, if required.
-
Rancher UI creates Health alerts as well (while deploying the application onto the cluster) as per the alert rules defined in the application Helm charts/Kubernetes manifests files. These alerts can then be notified with the help of Rancher Notifiers such as Email, Slack etc.
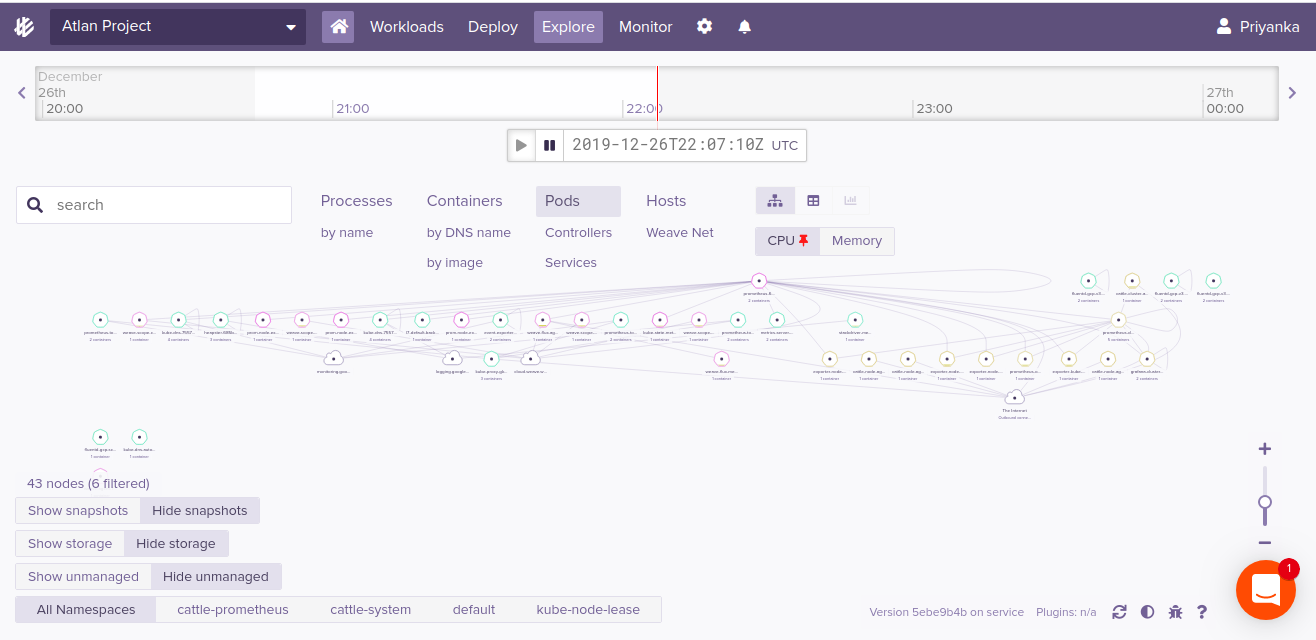
Apart from the Rancher metrics monitoring, this solution provides another platform for performing metrics monitoring i.e. Weave Cloud.
-
The Weave Cloud starts collecting monitoring metrics right from the moment when we connect our application’s kubernertes cluster to our (weave clould’s) project instance. Therefore, we can easily collect all the metrics (Cluster metrics, Kubernetes components metrics, resouce restarts and other triggered events information) from here as well.
-
The Weave Cloud UI provides ways to explore Kubernetes cluster components using interactive infographics, trees structure formats etc.This greatly helps in understanding the hierarchy of various Kubernetes components.
-
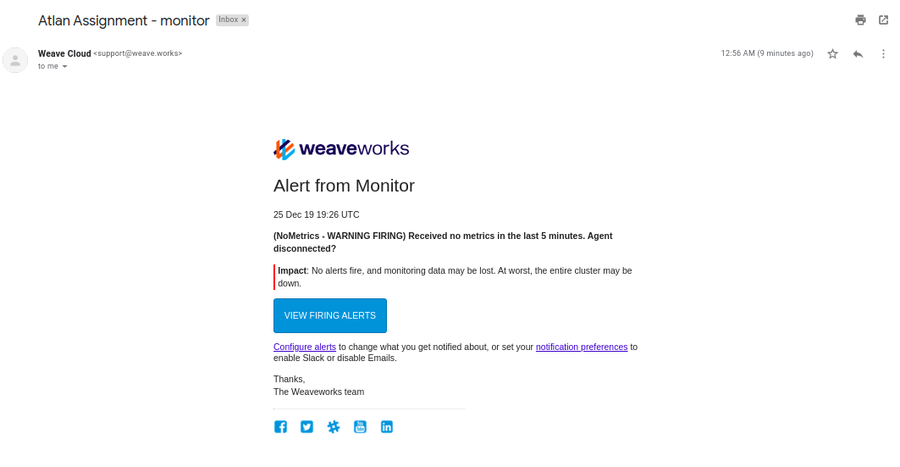
The Alert system and Health Check is much finer here. For every alert triggered (either by some resouce failure/no metrics collection from a certain period of time or by the CI/CD pipeline builds), the instance team members receive email alerts stating all of cause and concerns. You don’t have to explicitely configure the notifiers here.
Easy remote debugging
This is covered in the above point itself. The metrics collected either by Prometheus and Grafana in Rancher UI, or in Weave Cloud UI, most of them are used for remote debugging only. The cluster administrators, or DevOps engineers associated with the project/applications can quite nicely analyse the cluster health, generate statistical data with the help of metrics graphs created by Grafana or in Weave Cloud. So, the metrics monitoring simply serves cluster (or application’s) remote debugging.
Application Security (with source code protection)
I was doubtful while incorporating this part in my solution. I am not sure what this part actually means but in my opinion, I can suggest the following for Application security.
-
As the whole solution is framed around Rancher tool, so first means of security is by Installing Rancher Server With SSL. In order to run Rancher server from an https URL, we will need to terminate SSL with a proxy that is capable of setting headers. It can be setup following this documentation.
-
Second means is with the help of Rancher Security feature which includes Roles, Pod Security Policies and Authentication. There are different authentication support provided by Rancher and the roles are basically RBAC (Role-based access control) powered. Whenever you create a user with a role it is actually getting created inside the cluster with RBAC.
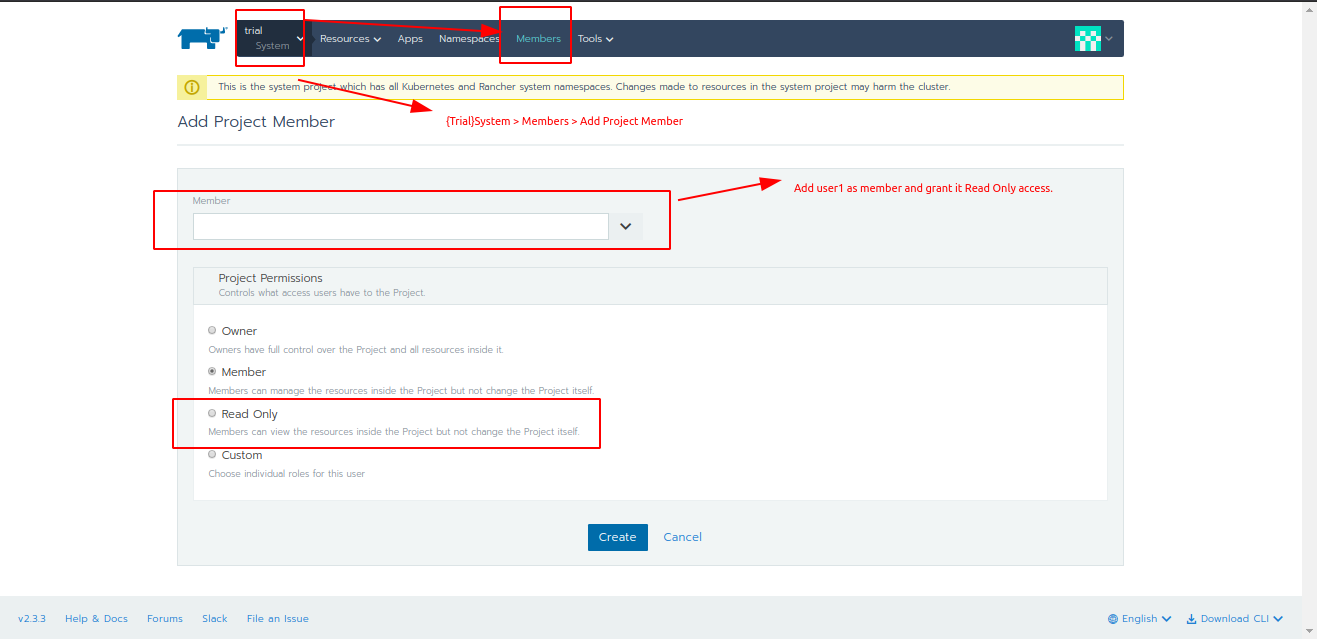
- In short, we need to create cluster roles in the Rancher which provides limited Grant for resources.
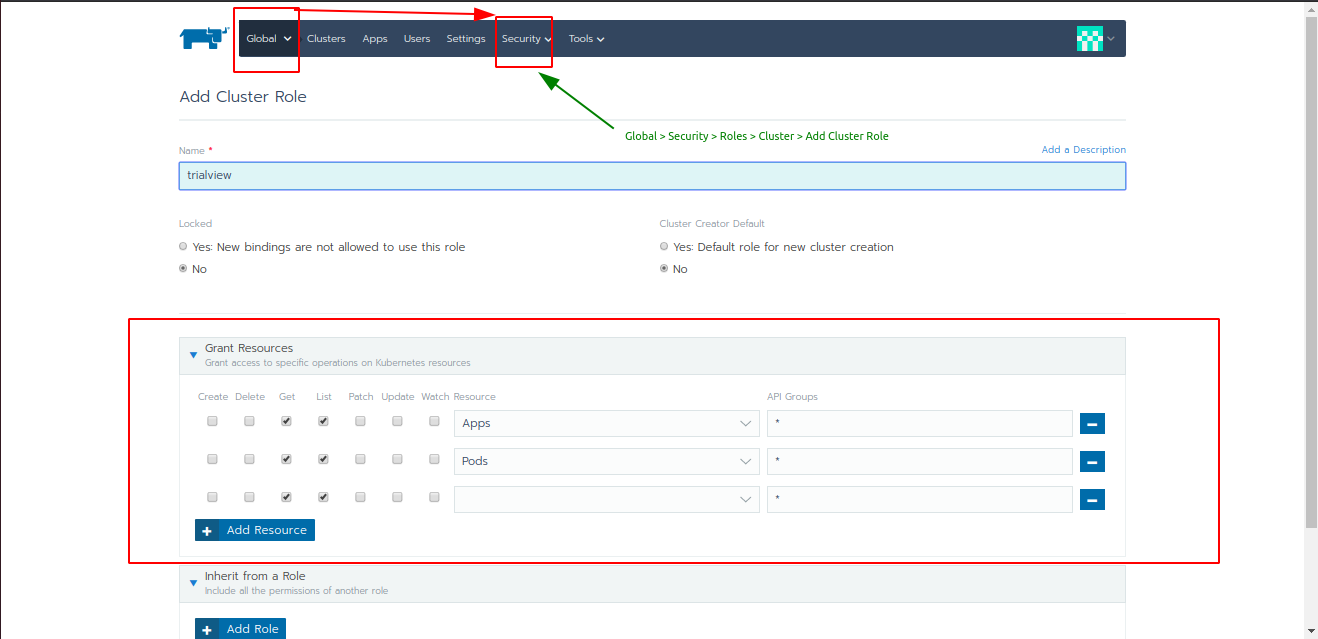
- And then create a user (out of standard user, administrator, or with custom permissions)
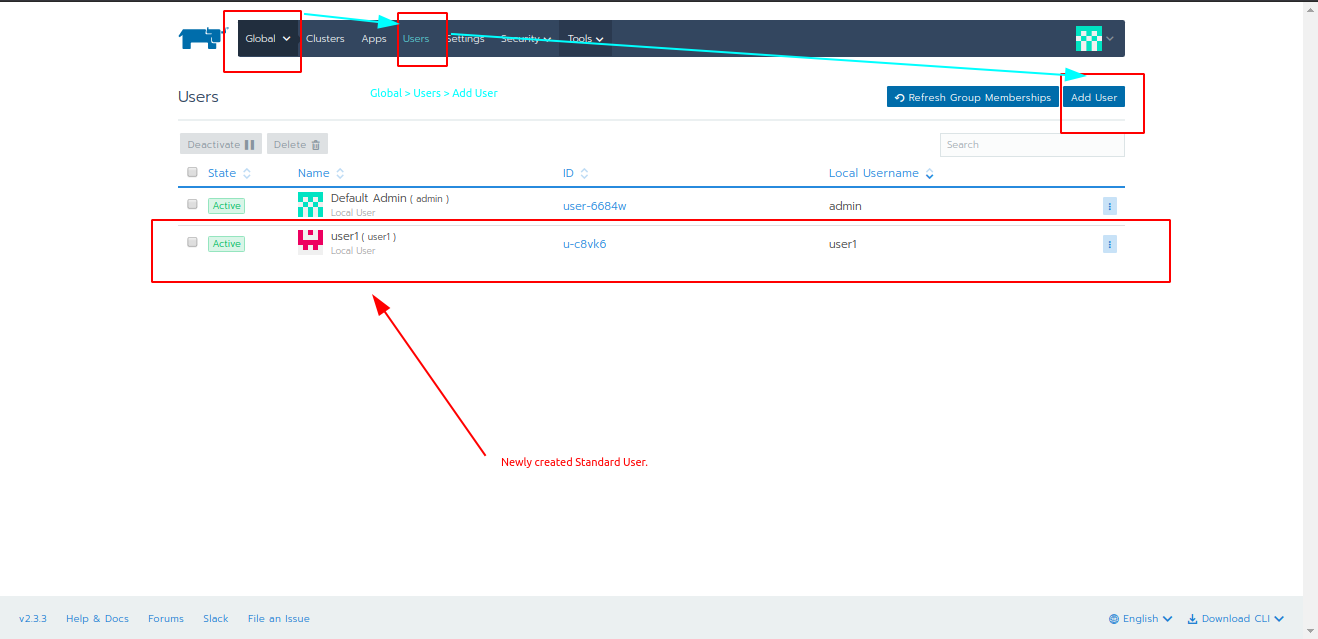
- Finally, add that new user as a member to the Project with limited access. (Check this post for refernce).
-
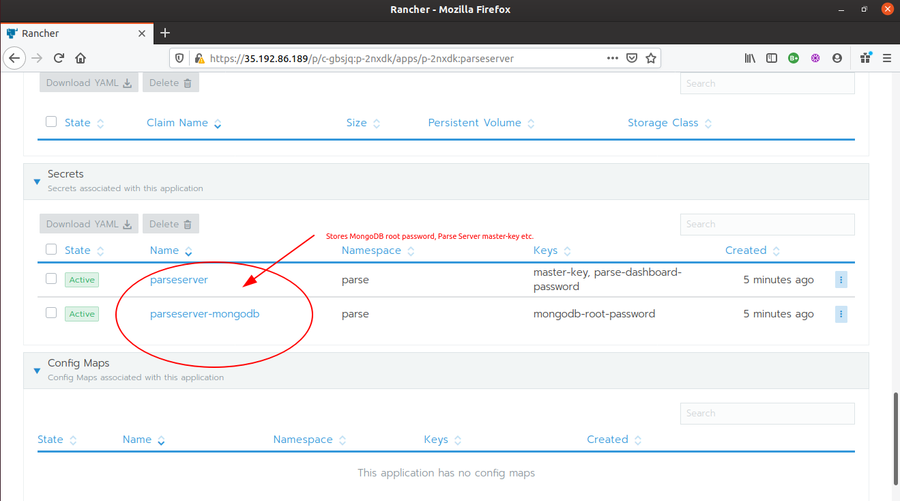
And the last measure is by making sure that the private data (such as in our case, MongoDB ‘s AppID and Master key) should be added into secrets with separate volumes and are mounted only at the time of cluster creation.
Disaster management
This part is taken care by the tool Velero. Velero helps mainly for the following:
- Backup and restore of your Kubernetes cluster.
- Copy cluster resources from one cluster to another
- Replicate your production environment for development and testing environments.
As we discussed above during the installation steps, we are trying to achieve Disaster Management mainly by creating backup of the cluster resources. So, that a failed/dead resource can be restored to an active healthy state in scenario of disaster. By the way, A disaster could be:
- Deletion of cluster resources or namespaces.
- Deletion of the whole cluster (which is not covered here but can be taken care of by valero itself with external storage setup).
- And in case of cluster migration from one environment to another.
We can understand the Kubernetes Disaster management using the following scenario.
- Let’s first backup any resource with labels “app=parseserver”.
velero backup create parseserver-backup --selector app=parseserver
- Now, I will simulate a disaster by deleting some resource/namespace from the application. So, that later I can perform restore from the above created backup image.
kubectl delete namespace parseserver
-
First, I need to create a restore from the backup. Then I can fetch that restore for recovery.
-
After a successful restore, the STATUS column is Completed, and WARNINGS and ERRORS are 0.
velero restore create --from-backup parseserver-backup

velero restore get
- If there are errors or warnings while restore, you can look into their details, using the following command.
velero restore describe <RESTORE_NAME>
That is all majorly about the workflow of the solution.
Data formats and Reporting
The Output data which we are receiving from this On-Prem Rancher setup are the various metrices received from Prometheus and Grafana. These metrices can be utilized by the concerned DevOps engineer or Systerm administration folks to analyze and obtain various statistical data from the running cluster. These statistics can then be used for processing information about the health of the application clusters, take productive measures checks and finally debugging the issues if required.
Metrices received from Prometheus monitoring
- CPU Utilization
- Memory Utilization
- No./Percentage of Pods used
- Health of Pods, Controller Manager, Schedular and Nodes
- Events associated with current cluster
Metrices (and graphs) received from the Grafana live monitoring.
- Cluster Metrics
- CPU Utilization
- Load Average
- Memory Utilization
- Disk Utilization
- Disk I/O
- Network Packets,
- Network I/O
- Kubernetes Components Metrics
- API Server Request Latency
- API Server Request Rate
- Scheduling Failed Pods
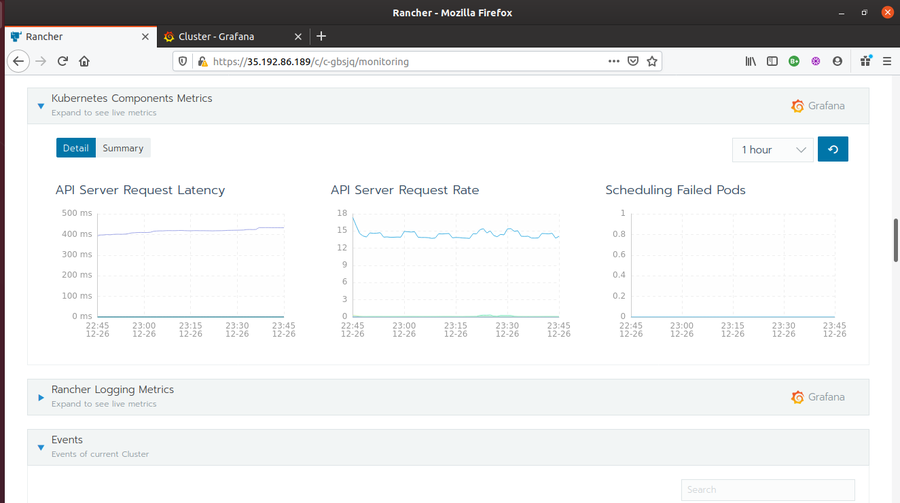
- Rancher Logging Metrics
Performance and Scaling
Ususally, the performance is improved by scaling (downwards or upwards) the application whenever required, but quickly. For instance, in case of peak hours, we might need to scale the application to multiple podes, or even to multiple nodes sometimes. Rancher UI makes it really easy to perform scaling (and yes, horizontal scaling) by means of just few clicks.
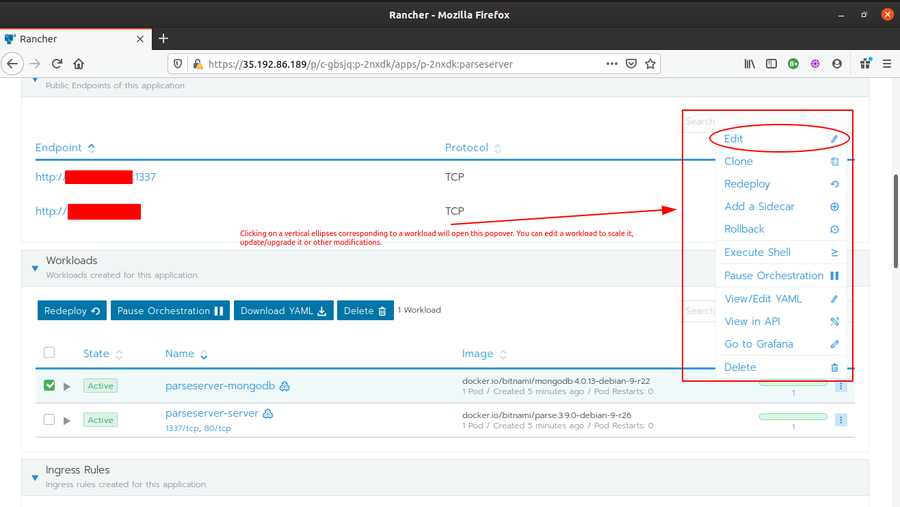
Let’s try to understand the scaling process by increasing the number of pods for one of the workload from our deployed application (I am taking parseserver-mongodb workload for the example)
-
Go to Rancher {Trial}System > Apps, and click on parseserver application.
-
Scroll down and look for parseserver-mongodb workload in the Workloads section. Click on the vertical ellipses corresponding to the workload and click edit.
-
Under Edit Workload, look for Workload Type and increase the number to 2 and click save.
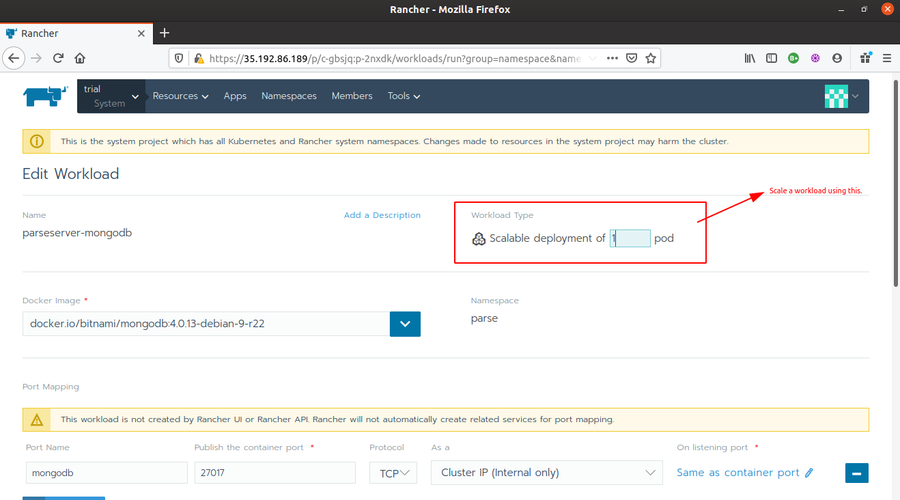
-
You will see your workload turning to
Updatingstate and your pods increasing to 3 once (2 running, 1 removed) and then finally turing to theActivestate with 2 running pods.
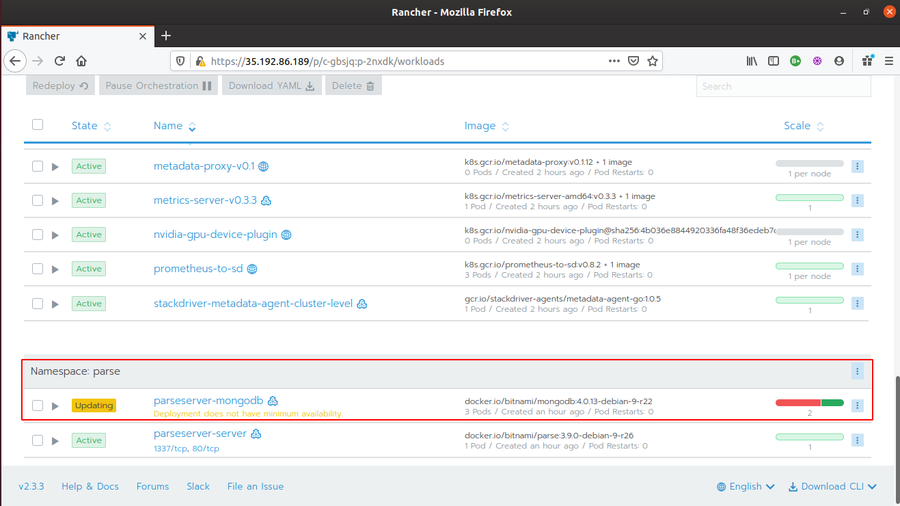
This scaling basically creates 2 new pods and try to remove the 1 old post (so, 2 new + 1 old =3 in total). That’s why you see 3 pods at some moment.
Unresolved issues
-
I wanted to create a jenkins CI/CD pipeline or argo-cd pipeline for the application remote updates triggering part. But as I spent the whole time learning how to use Kubernetes, other monitoring tools, and actually almost everything used above right all from scratch. And then framing the actual solution also took time. So, I resolved to using Weave Cloud for now.
-
The Velero backup should be stored inside an external storage volume but having lack of cloud storage resources, I was not able to achieve it.
Some other tools that I tried.
- Minikube
- Kubdeadm
- RKE (Rancher Kubernetes Engine)